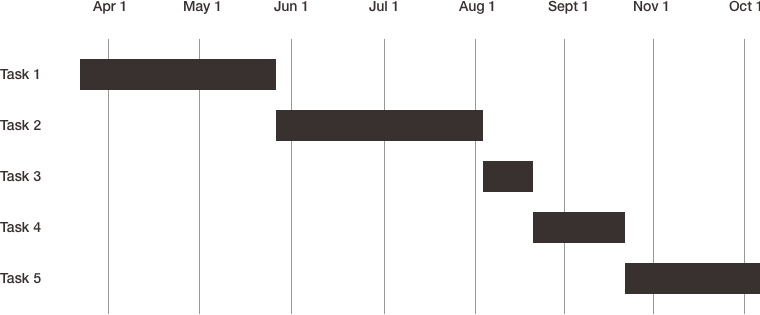
On the vertical axis of the Gantt chart there is a list of tasks: task 1, task 2, task 3. On the horizontal axis there are dates: Apr 1, May 1, Jun 1. It is important for each task to mark the start date and the deadline. This way, colored bars meaning the extent of the tasks appear opposite the tasks.

A Gantt chart is nostalgia for the time when it was possible to plan a project every day for many months in advance and know for sure that nothing would interfere with your plan. Today, only few people have such illusions.
Nevertheless, the Gantt chart is still good as the major project steps visualizing. It can be safely used for commercial offers, cost estimates and presentations. It helps the customer clearly see the project stages and the time frame for their implementation. The main thing is to form a Gantt chart with tasks for 2−4 months, otherwise any unforeseen development will kill its relevance and you will have to redo everything.
Also the Gantt chart is more suitable for small projects with up to 10 people. It can't handle larger projects. If you record all the processes in one chart at once, you will get a mess.
The Gantt chart also shows the following:
How good you are at sequencing actions
If sometimes a lot of bars overlap each other, and sometimes there are no bars at all, then you will either have to slog away in a rush or have nothing to do. Imagining such a layout without visualization is not easy — you need to keep an awful lot of dates in your head. The Gantt chart helps to plan the stages so that, on the one hand, no one to die, and on the other hand, resources not to be idle.
How good you are at priorities
The Gantt chart shows right away that more time is spent on a low priority task and the main one is neglected. Do not do it this way.


